Unlock the Future of ESG & Carbon Reporting
We're developing an intuitive SaaS platform for ESG and carbon reporting. Join us as we shape a solution for regulatory compliance.
Join the Waitlist
We're developing an intuitive SaaS platform for ESG and carbon reporting. Join us as we shape a solution for regulatory compliance across South East Asia.
Email: [email protected]
LinkedIn: www.linkedin.com/company/sustainasys
Legal: Privacy Policy | Terms
About the Team
Founder
As the Founder and CEO of Sustainasys, I lead our mission to revolutionize carbon accounting and sustainability reporting for businesses in Southeast Asia. With over 15 years of experience in sustainability engineering, low-carbon technologies, and SaaS innovation, I am committed to providing companies with a tool that ensures audit-ready compliance and real-time emissions tracking.Before founding Sustainasys, I led business development for Honeywell’s low-carbon solutions and developed low-carbon technologies for Chevron Phillips and Stratas Advisors. My experience in regulatory compliance, carbon solutions, and strategic partnerships shaped the vision for Sustainasys as a user-friendly platform tailored to the complex needs of Southeast Asian markets.At Sustainasys, we aim to simplify carbon data management, reduce manual reporting efforts, and provide businesses with the tools to achieve net-zero goals through transparent, accurate, and automated carbon reporting.
Cofounder
In Discussion for Technical Cofounder
Sustainability Methodology Specialist
Sustainability Data Specialist
Hiring
1. Solution Architect (Contract)
2. Senior Developer
3. Business Rule Analyst or Decision Modeling Consultant (Contract)
4. IT Assurance Consultant or Compliance Policy Writer (Contract)
Email: [email protected]
LinkedIn: www.linkedin.com/company/sustainasys
Legal: Privacy Policy | Terms
-- Vision --
To build the world’s trusted ecosystem of emission data, enabling collective action that transforms regulatory risk into industry-wide sustainability, transparency, and enterprise value.
-- Mission --
To deliver a trusted, interoperable data infrastructure that connects operational emissions to transparent compliance and industry benchmarks, empowering asset owners, regulators, and stakeholders to collectively achieve verifiable sustainability goals.
-- Core Values --
Integrity: Uncompromising trust through bank-grade security, independent auditability, and ethical stewardship of data.
Precision: Source-level accuracy that eliminates estimation, bias, and greenwashing, ensuring every metric is defensible.
Translation: Turning engineering complexity into actionable insights for executives, regulators, and investors.
Collaboration: Building bridges across companies, industries, and regulators to accelerate collective sustainability progress.
Transparency: Open, verifiable data flows that make sustainability measurable, comparable, and accountable.
Email: [email protected]
LinkedIn: www.linkedin.com/company/sustainasys
Legal: Privacy Policy | Terms
Current Collaborations & Engagements
In discussions with A*STAR on exploration
Email: [email protected]
LinkedIn: www.linkedin.com/company/sustainasys
Legal: Privacy Policy | Terms
Why We’re Inviting Partners
Why We’re Collaborating With Boutique Firms
Carbon accounting workflows differ across firms. Instead of building in isolation, we’re partnering with a select group of boutique consulting teams to shape a tool that automates computation, ensures audit-readiness, and fits real consultant workflows — not generic templates.
Joining as a design partner gives you early influence, priority access, and long-term competitive advantage.
What We’re Building
1. Audit-Ready Structured Inputs
SAP-style manual input that ensures defensible, consistent data — without messy spreadsheets or uncontrollable formulas.
2. Automated Computation + Summarization
Our engine handles emission factor logic, calculations, normalization, and reporting summaries — saving hours of manual consultant time.
3. Full Data Lineage + Consultant Audit Trail
Track every input, calculation, and change. Validate every number. Build confidence for verification reviews and client scrutiny.
What You Get as a Design Partner
✔ Early access to the prototype and core compute engine
✔ Direct influence on workflows, data structures, and output formats
✔ White-label options for your firm’s methodology and branding
✔ Priority roadmap placement for features you need
✔ Competitive edge vs. other consultancies adopting off-the-shelf tools
Proof of Concept (Early Demo)
Our current toolkit demonstrates structured inputs and the early computation pipeline.
Audit-trail and data-lineage modules are now under development.
Interested in Joining as a Partner?
We’re selecting a small group of boutique consulting firms to co-develop the next generation of carbon computation tools.
[Book a 20-Minute Call]
Email: [email protected]
LinkedIn: www.linkedin.com/company/sustainasys
Legal: Privacy Policy | Terms
Thought Leadership
Thought Leadership on ESG and Carbon Reporting
We’re committed to driving change and sharing valuable insights with the ESG community. Our articles explore the latest trends, regulations, and best practices.
07 Oct 2025
Scope 3 “People & Property” Emissions: From the Office to the Airport
“Many Scope 3 emissions do not occur in factories and logistics of delivery, but by commuting, travel for business, waste, or through leases for real estate. For many companies, especially professional services, technology, media and finance, 'people and property' emissions are some of the easiest to identify and mitigate. Under IFRS S2, they are no longer just the problem for HR or for the facilities department, they are part of disclosures related to enterprise value. So CFO’s, sustainability groups, and facilities managers must work together to turn these emissions which are part of daily lives into early wins in the way down the Scope 3 pathway.”
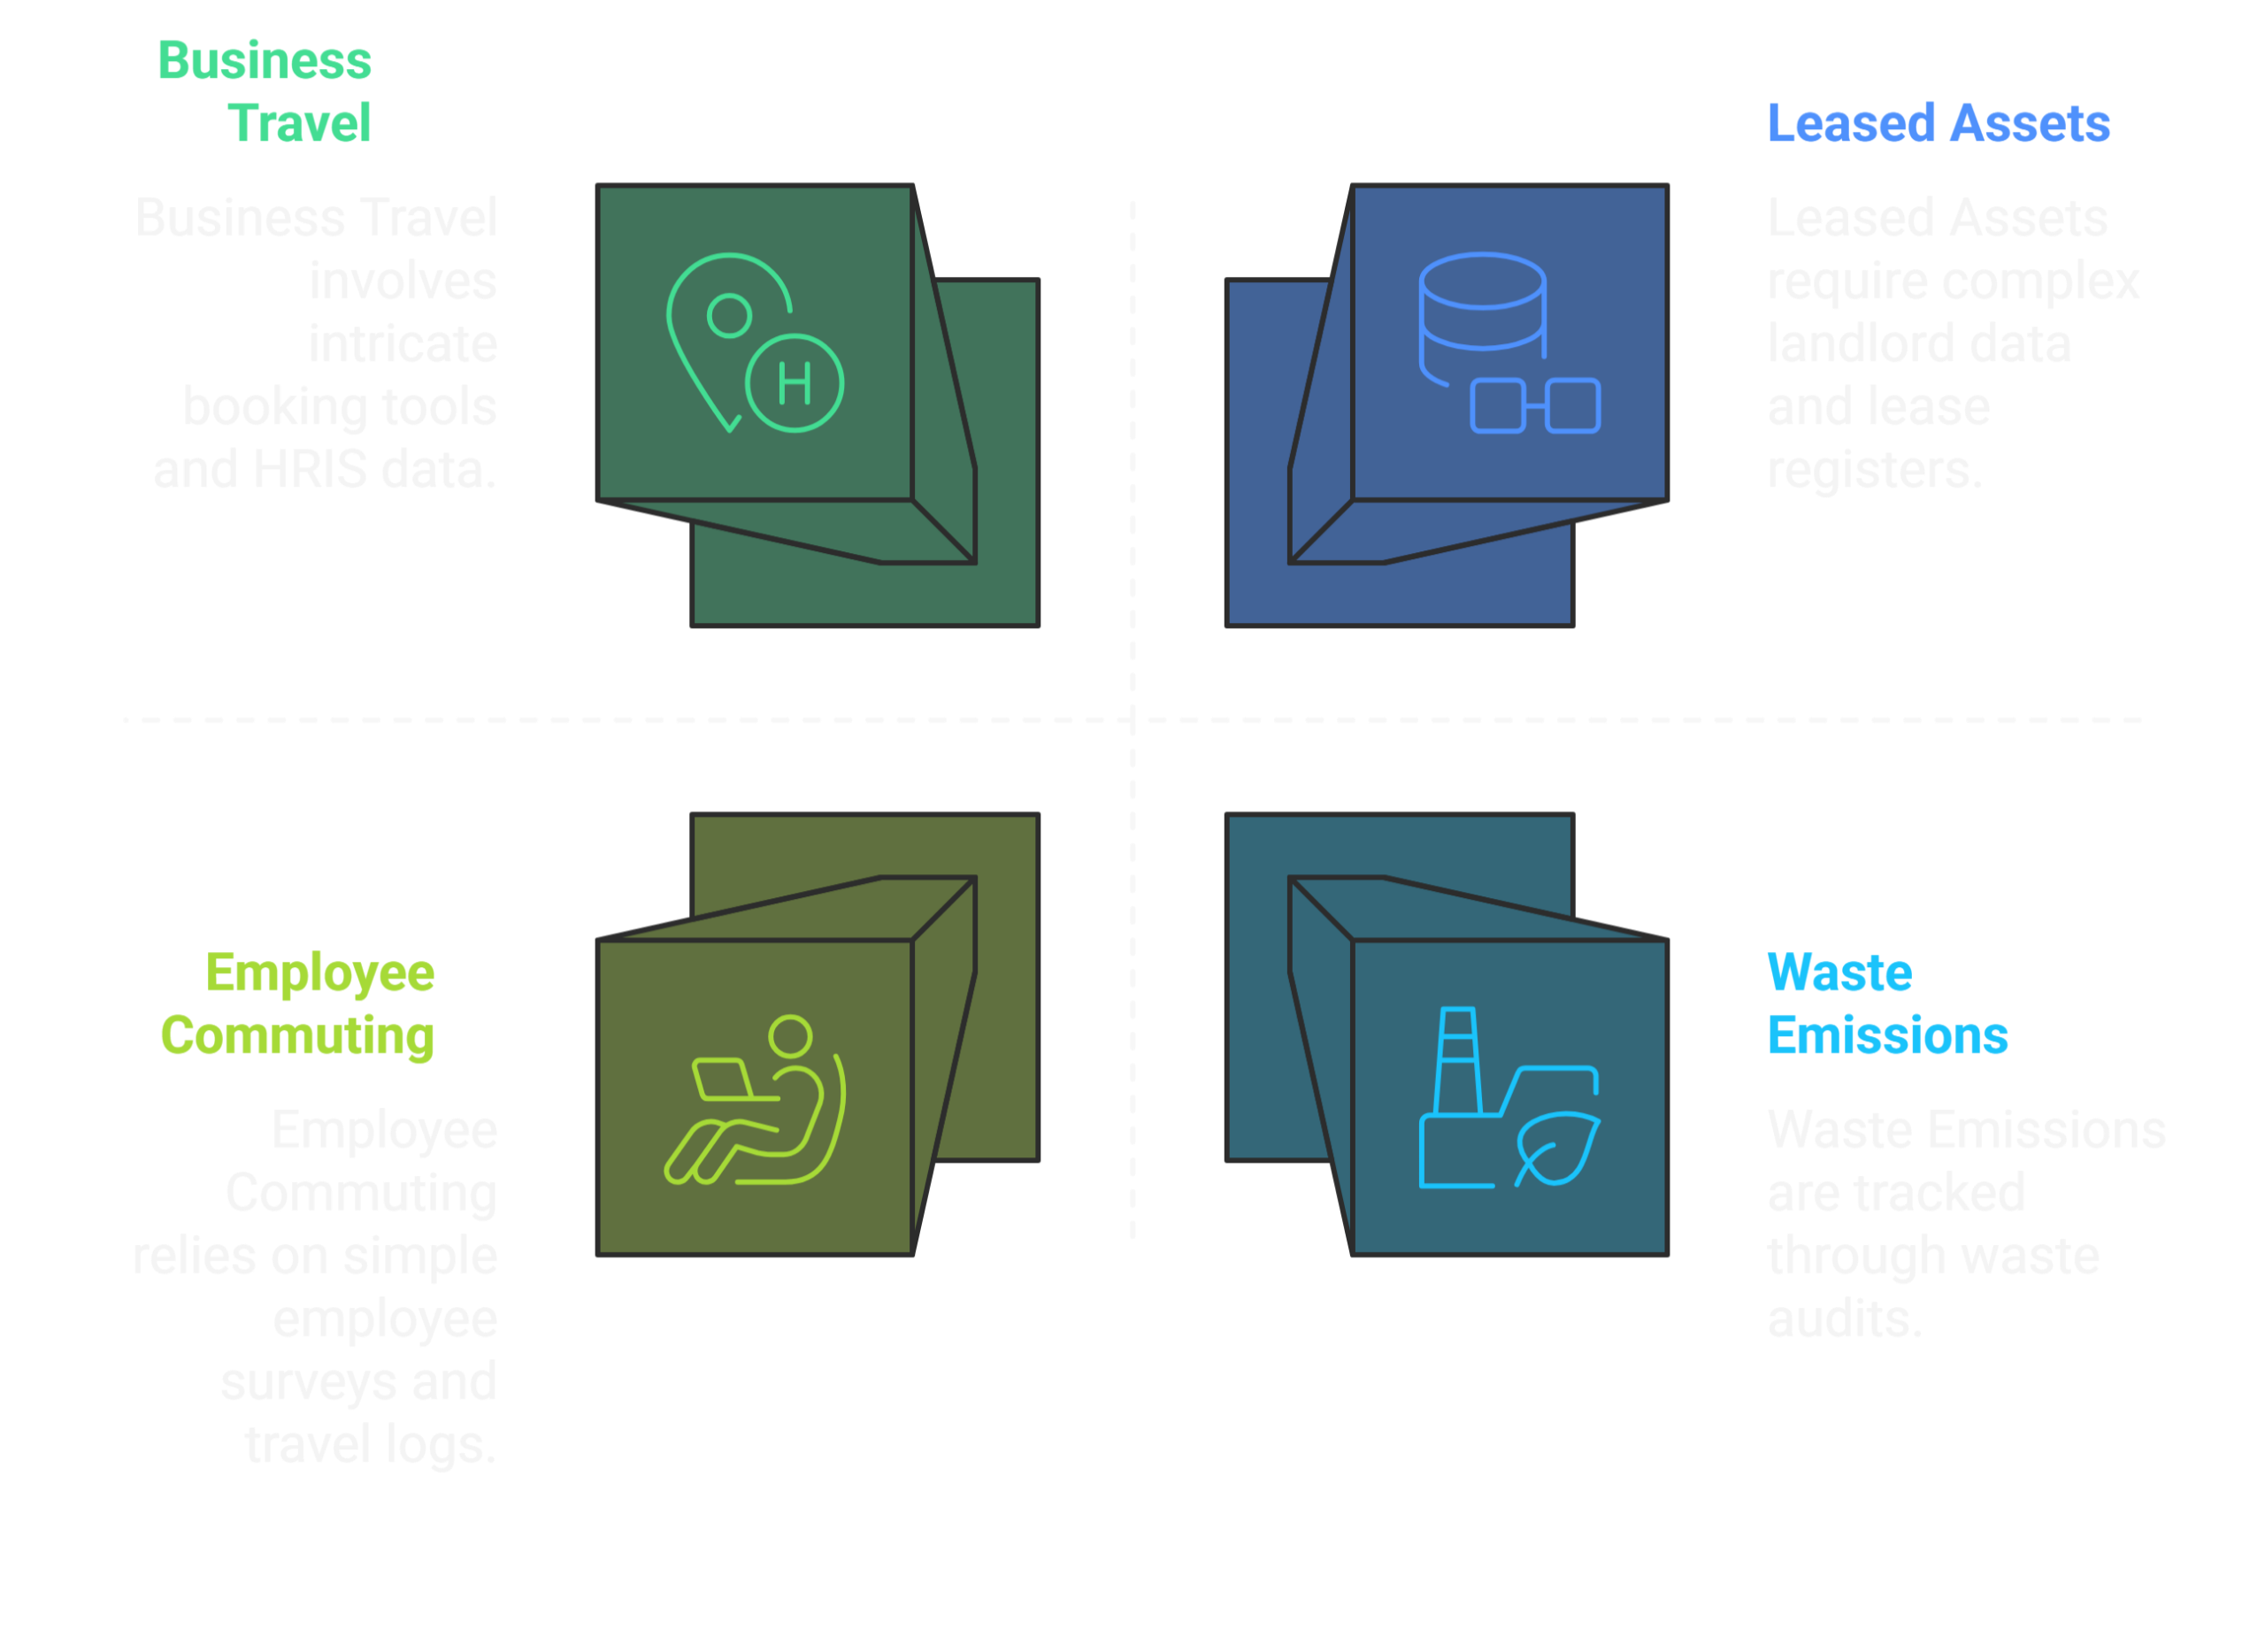
Framing the People & Property Categories
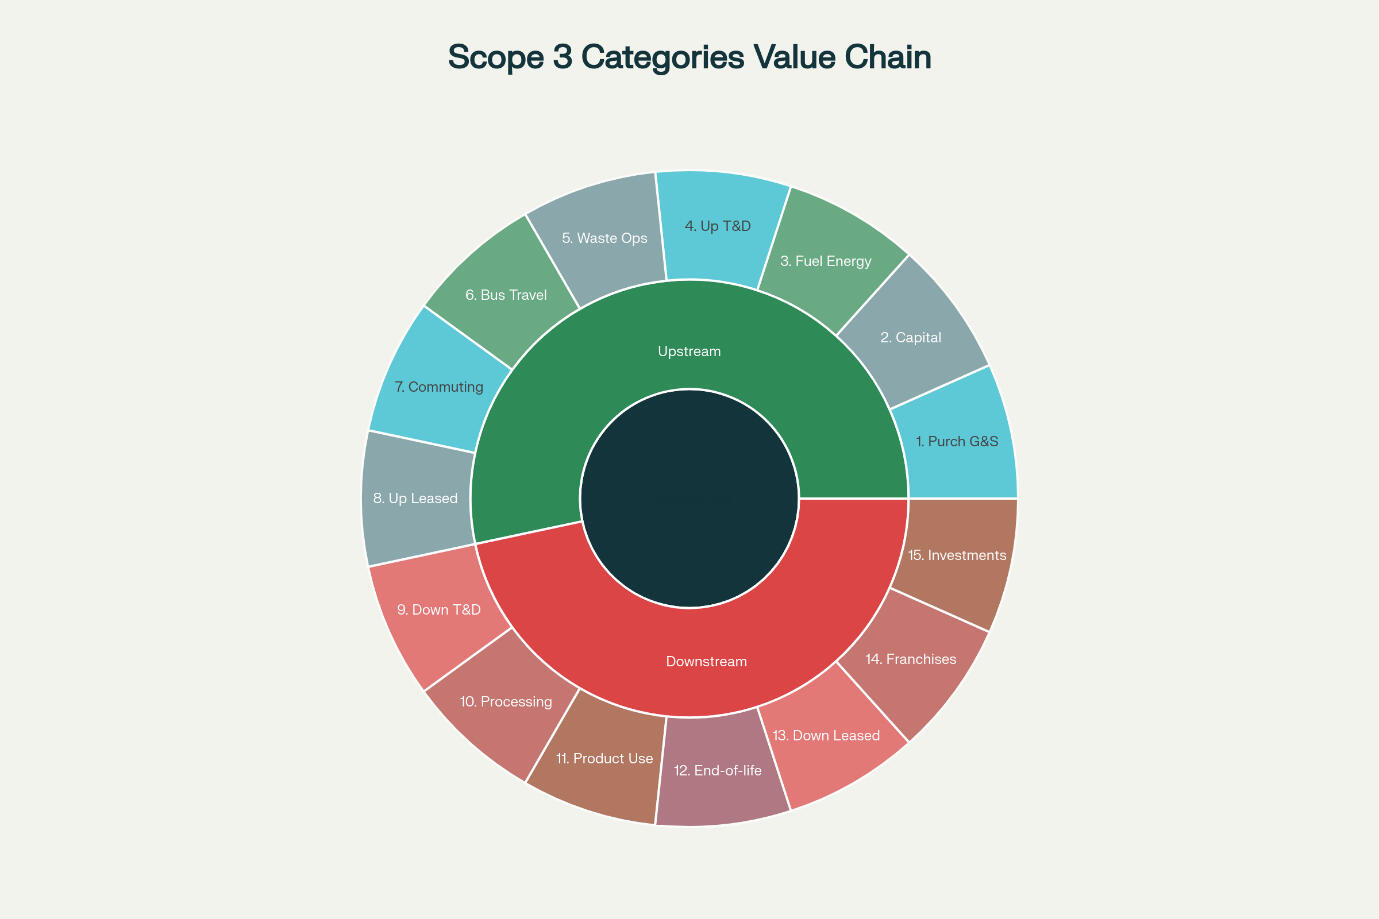
Under the GHG Protocol, five Scope 3 categories are produced by employees and leased assets; Category 5 waste generated from operations, 6 (business travel), 7 (employee commuting), 8 (upstream leased assets) and 13 (downstream leased assets). Each constitutes a portion of emissions that are not under the direct control of the company, but are related to the company’s ongoing operations. Thus, category 5 refers to treatment offsite of waste to office or facilities (landfilling, recycling, incineration, etc). Category 6 refers to all of the employee trips for business (including air, rail, hotels and rental autos). To Category 7 are referenced all employees on their commute to or from work (includes car, transit, cycling or energy to the home-office), while assets to which company leases and operate are included in category 8 (leased office buildings, warehouses, or vehicles). Category 13 would be the assets that the company leases to others (franchise stores, equipment rentals, etc).
These categories are of different importance by company types. In consulting and finance companies, business travel and commuting are the most important. For instance, in a survey relating to the industry segment, business travel was found to be 53% of total emissions in a consulting company, and 36% of the emissions of a bank and these are much higher than the 12% that is typical for manufacturing. On the other hand, companies in manufacturing and energy find commuting and travel relatively unimportant usually in their total emissions approach. For companies in technology and media industries, employee commuting and leased data centers, or office buildings may play a more significant role, particularly since they have large campuses for instance, or they have outsourced data center support (Category 8). In retailing, downstream leased assets loom large, such as franchise stores or leased outlets, which may constitute the larger percentage of their total benefits (as found by Fortune Real Estate Investment Trust, downstream leased assets were “a majority of its Scope 3 emissions” for a retail landlord). For logistics or manufacturing companies, upstream leases (leased trucks, leased facilities) and office waste may prove to be of larger significance.
All of these categories are fairly accessible when compared to core value-chain emissions, since they relate to internal information such as flight bookings, HR data, lease data files, or utility records, data that companies generally have or that can be easily accessed. More importantly, they generally are those expenses and emissions that have quick turnaround. For instance, measuring hotel nights or airline tickets is much easier than determining what the supplier footprints are. Similarly, encouraging recycling or redoing a travel policy may make them accessible quickly. For a company in the early stages of using Scope 3 accounting under IFRS S2, the tackling of the people/property categories represents an easy and quick firm through process (early wins) and rapid progress for moving onward to greater decarbonization for the value-chain.
IFRS S2 and Materiality of People and Property
The recently published IFRS S2 standard obliges full Scope 3 disclosures to be made in financial reports. This will actually require companies to take an inventory of the 15 different types of categories and reveal those they believe are material with respect to explaining the means used. The IFRS S2 standard directly links the matter of this to enterprise value: disclosures made relating to climate have to indicate to investors “the effect of climate risks on cash flows, access to finance or cost of capital”. Thus, the carbon emissions of offices will also matter in relation to valuation.
The IFRS S2 standard considers all of these categories equally, but companies will at the same time perform a materiality assessment (in the relevant sort of financial-materiality) as to which they believe it would be wise to concentrate on. For example, for a technology company with several leases of offices and with commuter traffic, Category 8 and Category 7 might be classed as material. It is evident from the other side of the equation that for a consultancy, Category 6 will be material. The guidance provided by IFRS expects that companies will consider the closing things in each of the categories and justify those they regard as making material disclosures. Noteworthy here is that category 6 and 7 categories can be extremely material depending on the nature of industry in relation to services, since they can make up as much as half their total footprint, but perhaps negligible in capital intensive industries (on the other hand, though, CDP has noted that travel and commuting average only about 0.1 to 0.2% of total emissions relating to their forms of heavy industry).
These people and property emissions have, however, a common connection with enterprise value. For example, cuts made to travelling would mean cash savings made for transport costs and hotel bills. Abatement made to leased-space forms of emissions (fewer offices with reduction of carbon-footprint rents which are more energy efficient) means reduction of resources spent on real estate. It is not simply company secretarial work which can mean something for investors and company regulatory authorities with respect to the analysis of risks here, since leasing and travel policies are forms of indicators of the differing effects of the climate. For instance, where the carbon emissions are reduced or green leases obtained there is manifest evidence of robust risk management given to investors and rational risk management. This indicates that monitoring and managing emissions arising from commuting, travel, waste and leases imposed does not achieve simply company social-responsibility objectives but aids the financial equation. The climate-related disclosures here provided for by IFRS S2 ought to be taken as of factual evidence which in all probability “could influence investors decisions”, and by emission values given by people and property certainly do have a favourable effect on cash and risk.
Quick Wins
why these categories are a practical place to start. These five categories are usually the ones that companies handle most readily. They both permit fairly easy data collection and present fairly obvious levers for emissions reduction:
• Easier access to data. Employee trips and travel may in any case be contained in corporate data systems. Travel spend or mileage for employees may be obvious from use of booking systems. credit card systems or expense reports. Patterns in the employee commuting behaviour may be summed up from HR records. Lease data are likely to be with real estate or financial officers — aggregate data relating to leased buildings and vehicles is kept from an accounting point of view. In contrast, some of the other Scope 3 categories, such as purchased products, require millions of supplier surveys or convoluted LCA data to produce useful data. In the people/property area, the company can often start with its own internal or estimated data, or known standard emissions factors.
• Greater internal control. Companies can make travel and direct office changes than upstream supply chains. Their own internal industries may be difficult to decarbonise rapidly — eg their purchased airline asset bunch but companies can certainly stop short haul travel, negotiate with their travel management companies or change their booking methods. Companies set HR policies as to remote work or commuting incentives. Facilities departments control contracts to garbage disposers or waste disposal contractors can achieve a sensible control over waste disposal and office layout. These are “low hanging fruits”, so the company is in control of them.
• Low-cost savings. The actions that one can take often save money. The encouraging of rail or video conferencing instead of flight travel saves on travel expenditure. The consolidation or rental of office reduces on rent and energy account. The expansion of returnable containers or curbing the use of disposable single use objects mean that one might save money on waste disposal fees (eg it would appear that Deloitte Germany have (inter alia) reduce emissions from travel by 30% by reducing the emissions reporting functions which have for example set out features which are “trendy”, also, enabling travel costs from lower ticket costs to be achieved) . These categories have positive levels of ROI — (for example) a travel policy which would cause cash outflow at the beginning but would redevelop itself with reduced cash costs quickly afterwards (or the same result is achieved through green leases).
Common emission sources and data holders: emissions are found from obvious sources in practice, viz: air travel, hotel nights, taxi/trains (CAT 6), cars/busses, metro rides by employees (CAT 7), office weights of waste by disposal type (CAT 5), energy consumption by employees in rented buildings (CAT 8/13), etc. The data generally is available in HR/Payroll (employee numbers, surveys of employee behaviour in commuting), Travel/Expense systems (tickets issued, mileage), Facilities/Real estate departments (rent registers, utility statements/waste disposal sub-contractors) and Finance/Accounting (lease accounting). A company is working on the basis of its weekly payroll system to make surveys of their employees commute behaviour (method of conveyance/distance travelled) as the RAW locational base inputs to the model would require that mileage be used/regulated by the mean UK government input emissions factor numbers to be supplied by basing value of their emission figure on the shopping departures for these. The facility more unlikely though, is to be reviewed in determining emissions measures under “reporting” basis of evaluation commonly current e.g. for air travel (researching expenditure data is generally more fruitful than mileage coverage), if they are reported on schemes (e.g reimbursement by finance for the air travel) used), and these facts may be fed into monthly number summary statistics sub-classified for economies for knowledge business travel). Many would agree, a rapid view for the commuter survey information may be based upon estimative values with location averages or working in detail for costs of expenses claimed timely presented (e.g mileage reimbursement values), whereas the business travel data may be more readily obtained clinically, due to its inherent expense values, but times may be more rudimentary less useful (or accrual accounting systems relating to true measure of meaning which will have to be “revised” before “reporting” treatment may be effective).
Real World Examples
A slew of companies is already confirming that the "people and property" approach genuinely works.
• Reducing travel emissions: The biggest professional services firms now treat travel, like any utility—measure it budget for it and adjust as needed. Deloitte Germany for example has woven Salesforce’s Net Zero Cloud into its workflow giving it a view of consultants’ trips. That granular monitoring uncovered levers to slash air travel. In Deloitte’s deep dive which "evaluated employees’ travel behavior in detail " the firm discovered that smarter booking choices and a pivot, to work could trim roughly 30 % of its flight related emissions. (Salesforce says that firms tapping its platform are increasingly gravitating toward meetings: a recent poll reveals that 76 % of companies are pushing gatherings online 58 % have rolled out restrictions, on travel frequency and 55 % are curtailing long haul trips.) Those technology driven shifts translate into carbon cuts and noticeable cost savings. In parallel a slew of consulting outfits now log flight miles per consultant, per project reshaping travel from a footnote into a managed KPI. Often the payoff is far larger than one might think: trimming just a handful of flights can noticeably shrink a company’s carbon footprint and win the admiration of clients who insist on low carbon operations.
• Decarbonising Leased Buildings: Within the property world landlords now view their leased spaces as a source of Scope 3 emissions. Fortune Real Estate Investment Trust—operating shopping centres, in Hong Kong—realised that the lion’s share of its Scope 3 carbon footprint stemmed from the energy consumption and waste produced by its tenants. To curb that the REIT rolled out "green lease" provisions that compel tenants to report their energy use pursue efficiency improvements and partner on waste management efforts. It also overhauled the building systems in 85 % of its portfolio installing controls and efficiency upgrades that trimmed the properties’ emissions. The same playbook is emerging elsewhere: several REITs and property owners embed clauses that compel landlords to disclose energy use data or to fund installations. Likewise, firms that lease office space (Category 8) can now require sustainability metrics from their landlords. Simply choose buildings certified under LEED or ENERGY STAR. Microsoft as a case, in point is chasing LEED Gold or Platinum status for its data center and office projects a move that locks in low carbon footprints for its leased properties. The payoff is two pronged: improved energy performance trims emissions while landlord disclosures bolster the rigor of the firm’s reporting.
• Mid size and non profit: Not just the giants can lead. An NGO or a mid sized company launched a car pool scheme. Introduced flexible hours. Surveying 200 staff, about their commutes showed that a formal three day a week work from home policy could cut car travel by 15 %. The organisation then rolled out an incentives drive—public transit passes, bike to work days—. Within a year saw a dip, in Scope 3 commuting emissions. Similarly, a regional bank went with a " collaboration mindset. By swapping out the habit of sending audit crews to branches for routine checks and instead leaning on video calls it managed to slash its yearly travel emissions by fifty percent (and shave off flight expenses) in just two years. Even lacking any tech a disciplined focus, on these levers turns out to pay dividends.
Cross-functional collaboration in practice
Getting people and property to generate rapid wins requires cooperation across the company. For example, cutting travel emissions requires collaboration between: travel/procurement (to identify low-carbon suppliers and booking platforms), IT/sustainability (to implement tracking mechanisms), finance (to embed travel’s carbon into budgets), and management (to impose new policies on meetings). Similarly, decarbonizing leased offices requires collaboration between: facilities/real estate departments (who audit the buildings and negotiate with landlords), HR/legal (who write green lease clauses, dispersed work polices), sustainability departments (who measure, monitor and report emissions), and finance (who allocates the emissions to the appropriate lease according to IFRS). A common approach is a cross-functional climate group or committee. For example, a large technology corporation formed an “Office Carbon Reduction Team” containing facilities managers, HR specialists and sustainability analysts. They used a common dashboard interface: facilities measured energy consumption inside the offices, HR sent out an annual commuting survey, finance calculated the emissions derived from leasing, and sustainability consolidated the data. This approach to governance (shared in large corporations) makes the abstract concrete: every department has part responsibility for the emissions picture, and meets regularly to set targets (eg “cut the energy intensity of offices by 10%” or “get 90% participation in the commuting survey”).Operationally, facilities/real estate teams could measure the energy use of each leased building, upgrade lighting/HVAC systems and convert to green power. HR could assist with the distribution of remote working and commuter surveys as well as create incentives (like transit subsidy or flexible hours). Finance makes sure leased assets are tagged right (e.g., with IFRS 16 data), and also integrates Scope 3 figures into budgets. The calculations are made by a sustainability or ESG team - emission factors applied to miles, waste and utility data - and progress is reported. For instance, one manufacturing firm gave its HR and facilities chiefs joint accountability for a goal of a low-carbon workplace, with carbon KPIs in their performance reviews. This wide ownership promotes the type of culture needed: travel or waste reductions now become everyone’s affair.
Industry-Specific Hot Spots
Every industry defines its own profile of people/property. Some examples:
• Consulting / Professional Services: very heavy intensity of business travel; and as noted, for consulting companies it may be that over half the emissions are business travel. Commuting can be quite high as teams travel among various cities which they service. Companies in this industry should study Categories 6 and 7 closely. Materiality should bring them onto the radar. Quick wins include stringent trip approval policies, internal carbon pricing on travel expenditures for air travel, and promotion of video or rail travel for meetings.
• Technology: Large corporations may have large real estate exposure (leases) or Data Centres. These will also be subject to accounting (Category 8) of emissions. In fact, the Data Centres leased out will count as upstream leased assets. Also tech hubs that lead to long commutes mean Cat. 7 will be important here. For example, a Silicon Valley company will find that commutation emissions will exceed those of energy for office purposes (which is a common result). Thus it will be important for companies in the tech sector to establish a service to shuttle employees to work, telecommuting facilities or branch offices, or instance developments of green energy sources at rented buildings.
• Retail: Retailers also have difficulties with access to mall locations. Many retail chains also operate as franchises or lease buildings used for retailing. So downstream leased assets (Category 7) are important here. In retailing among Parcel deliveries or restaurants, a tremendous amount of kitchen energy and food waste comes into play at franchises. Retailers have their own waste streams (packing waste, returned goods). In many instances it will be the matter needing to be solved as to how owners of franchise stores can cooperate with the franchisors in resourcing recycling or energy upgrades. On top of this, retailers also have corporate travel requirements, HQ commuting but generally much smaller than emissions from category 13.
• Education / Healthcare: Many of the larger campuses of educational facilities or hospitals would often include leased storage buildings. Commuting emissions (both from the student body and from employees working there) and emissions from the physical buildings used are likely to be considered part of the sizeable national total. For instance a university will find that students travelling to campuses or commuting will prove substantial niche market and as such may find it smart to implement bike schemes or hybrid learning. Hospitals may find it useful to investigate securing green leases with landlords, doing cutting of wastes (beyond medical waste) towards employee shuttle schemes providing better commuting facilities.
Then, again geography, and how polluting these cities are in terms of electric grid and transportations modes, causes differences. Part of any consideration of what is meant by “material” is strategic; IFRS S2 focuses on the point that even a category that has small emissions may be a matter of materiality if it does provide benefits/money opportunities in terms of cash flows. Likely if regulators create a disincentive for commuting via aeroplanes business for consultants is going to suffer from possible future penalties.
Steps To Take
Topics for organizations to tackle today in concrete terms include:
• Survey commute patterns. Have a simple digital commuting survey (or geolocation data) that maps how employees travel to work. A rough approximation (say average distances by zip code) is better than ignorance. Incentives (raffles, recognition) can be used to increase response rates. Once the data is in, set goals (increase carpooling or remote days to reduce commute miles).
• Centralize travel carbon calculations. Get (or upgrade) a travel management system used that tracks trips (flights, hotels, distance). Make it a rule that all bookings go through that system. For each trip calculate the CO₂. Build in dashboards and quarterly reports for managers to see which routes or business units are carbon intensive. Make travel carbon a metric that is visible.
• Review all lease contracts. Have the law and real estate departments put in clauses that require energy and emissions data from landlords (green leases) or commit tenants to sustainability standards. Audit the lease portfolio: find instances where there are properties without data and reach out to the owners for consumption reports. For expected terms, estimate emissions from square meters × average grid factor; for the longer term, push for actual results information.
• Update HR policies with carbon in mind. Update the remote work, travel and commuting policies to be in line with climate goals. For example: encourage virtual meeting etiquette, incentivize lower-carbon commuting, limit high-emission perks (frequent flying). Also ensure new hirings are aware of carbon-friendly policies. Such cultural encourages change the data into actions.
• Set targets for quick wins. Select one easy waste/energy goal to go after: that's to either reduce paper/plastic wastes by 20% +/or reduce office electricity by 15% by both LED retrofits + smart thermostats. Track progress publicly. When win-wins are seen - less wastes, smaller bills - there is momentum for larger Scope 3 initiatives.
Thus, the “people/property” areas of Scope 3 are a great testing zone for early climate action. They are measurable, often low hanging fruit, and linked directly to value for business. View the office commute, business trips or lease as parts of the carbon puzzle. In doing so, organizations not only tick off IFRS S2 boxes, but realize appreciable savings and show good management for investors. Such everyday emissions may seem peripheral, but, under the new disclosure regime, they are front-and-center for enterprise value. Moving such from blind spots into likely wins is both good business and climate practice.
29 Sep 2025
Upstream Scope 3 Emissions: Procurement as the New Frontline under IFRS S2
"Climate action starts with procurement. For many companies that have complex supply chains, upstream emissions—from raw materials, equipment, and logistics—are the biggest, and least understood, share of their carbon footprint. Categories such as Purchased Goods & Services and Capital Goods can account for upwards of 50% of total Scope 3 emissions. Under IFRS S2, finance teams now need verifiable, auditable data on these emissions—not a narrative or educated guesses. This means that supplier collaboration, data governance, and operational alignment are no longer nice-to-haves. They are required to meet compliance and authenticity."
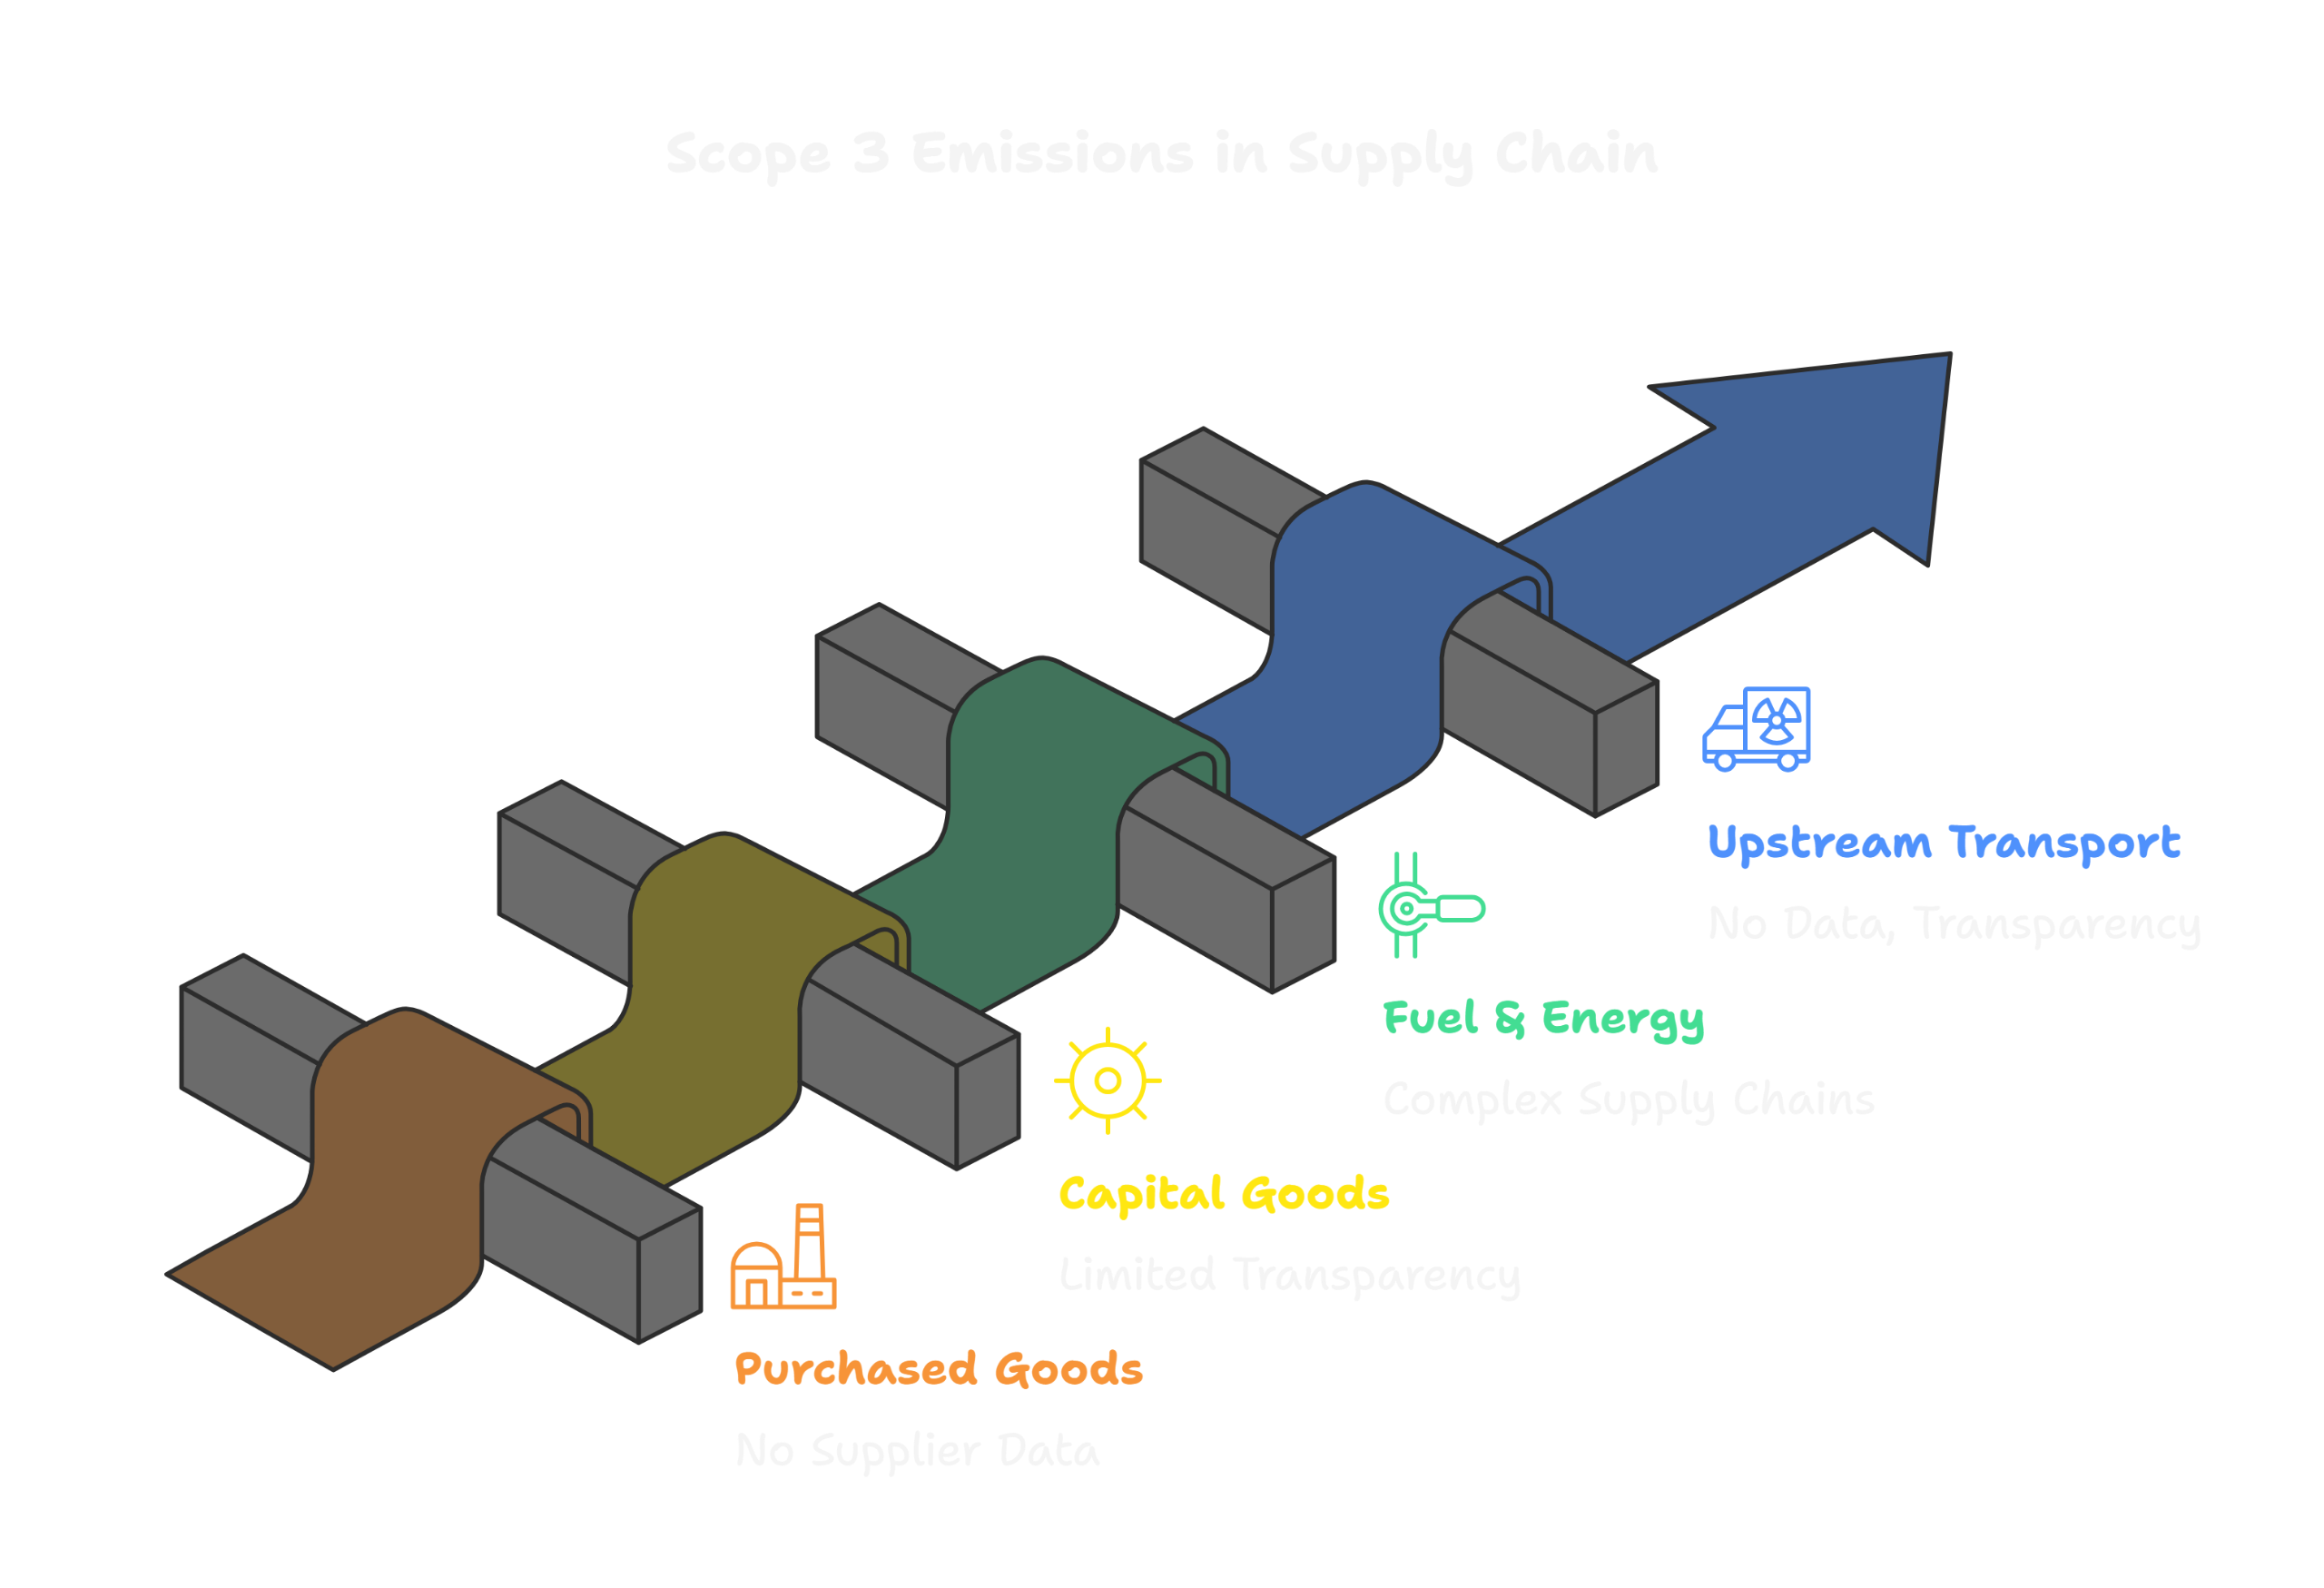
The Supply Chain Emissions Landscape
Scope 3 Categories 1-4 include big upstream sources of emissions:Category 1: Purchased Goods and Services - cradle-to-gate emissions of any and all inputs enterprises purchase.Category 2: Capital Goods - emissions that are embedded in assets with long lifetime spans, such as machinery or servers or buildings.Category 3: Fuel- and Energy - Related Activities (not in Scope 1 or 2) - emissions from the extraction or production of fuels and electricity entailed in the products purchased by enterprises.Category 4: Upstream Transportation and Distribution - emissions resulting from the transportation of incoming products and raw materials before they reach enterprise operations.These categories include some of the largest and murkiest areas of a company’s footprint. A 2024 CDP/BCG study found that Supply Chain Scope 3 emissions are on average, 26 time greater than operational emissions (Scope 1+2) demonstrating how much upstream emissions contribute to corporate climate impact.
Cross-Sector Examples
• Retail & Consumer Goods: materials alone represent 52% of IKEA total value chain footprint.
• Foods & Beverages: raw materials, ingredients, and packaging which represents 63% of Unilever Scope 3 emissions.
• Automotive: life-cycle assessment shows that embodied CO₂ associated with internal combustion engine vehicles (ICEVs) shows steel accounts for ~25-35% of total embodied CO₂, with aluminum and plastics contributing substantially as well. However, these percentages vary tremendously based on model and driveline.
• Apparel: polyester/textiles are dominated by supply chain emissions, with one study estimating upward of 70% of total retailer emissions emanate from their supply chain.
Measurement Challenges
The GHG Protocol identifies the following approaches to calculation: supplier specific data; data based on activity (e.g. kg emissions factor for steel); spend-based proxies. Nearly all companies use proxies as their main form of data, even with supplier data available; only ~36% report data on Category 1. Averages and spending-based factors add to uncertainty, which means there is room for improvement in supplier engagement.
IFRS S2 Requirements and Upstream Materiality
IFRS S2 (effective January 1, 2024 with jurisdictional adoption) requires disclosure of Scopes 1, 2 and 3 emissions in accordance with the GHG Protocol. Companies will need to assess all 15 Scope 3 categories, namely Categories 1 to 4, and disclose any material ones. Materiality is described in financial terms – information is considered material if the omission of that information would impact investor decision making. As upstream emissions can materially affect procurement costs, supply risk and exposure to carbon pricing they will be material for almost all sectors. If upstream emissions are forgotten, pursuit of enterprise value will suffer and stakeholders will be misled. For reference, CDP created an estimate suggesting that unreported emissions in the supply chain could lead to a carbon liability of over $335 billion if carbon pricing were taken into account.
Supplier Engagement Realities
The greatest challenge is still supplier data gaps. Too many suppliers, especially SMEs and Tier 2+ vendors, have no emissions inventory . The EPA guidance encourages negotiating with the ~20–30% of suppliers that account for ~75–80% of spending. This is a good way to prioritize the engagement.Unilever’s Partner to Win initiative is a great example of good practice: over 290 suppliers (~42% of Unilever’s value chain emissions) are now mandated to disclose data and set science-based targets . Climate criteria are embedded in contracts -- moving from encouragement to requirement to disclose.Despite this, many companies continue to rely on spend-based proxies. IFRS S2 provides that, but requires companies be honest about the underlying assumptions and data quality.
Procurement & Operations as Climate Champions
Procurement is not simply a cost-control function—it is a climate function. CDP notes that procurement teams are “on the front lines of supplier engagement” and can influence Scope 3 reductions. Some leading practices include: - Integrating carbon criteria into RFPs and supplier scorecards. - Prioritizing suppliers that have science-based targets and renewable energy purchases. - Collaborating with finance and sustainability teams to create audit-ready data flows from contracts into reporting systems. Examples include: IKEA requiring major suppliers to report carbon data through CDP. In the automotive sector, manufacturers are experimenting with contracts that reference low-carbon steel and aluminum.
Data Quality and Governance
To yield trustworthy disclosure, we require (1) Accuracy: Whenever possible, we prioritize supplier-specific and activity-based data above other factors. (2) Completeness: Ensure all relevant spend/emissions categories are included. (3) Consistency: Ensure you use the same methods annually (4) Transparency: Make available data sources and proxies used.Digital platforms (e.g., CDP Supply Chain, EcoVadis) and supplier portals will become a standard. Some companies are beginning to invest in “lighthouse” LCAs for the company’s core materials to develop a more reliable data baseline. Third party verification on supplier data is establishing as a best practice.In the end, trade-off is speed vs accuracy. Spend-based data is quick but unreliable; activity-based data takes longer but is auditable/defensible.
Sector-Specific Hot Spots
• Apparel: Textiles, especially polyester and cotton, dominate emissions.
• Tech: Capital goods (semiconductor and server manufacturing) are carbon-intensive.
• Food & Beverage: Agricultural inputs and packaging drive most emissions.
• Automotive: Steel, aluminum, plastics, and (for EVs) batteries are hotspots .
These hotspots underscore the importance of aligning Scope 3 inventories with sector materiality.
Actionable Takeaways
1. Identify key upstream suppliers and assess readiness. Focus on the “20%” of suppliers that are ~80% of spend/emission.
2. Incorporate carbon into the procurement process. Climate criteria could be created in contracts, RFPs, and scorecards.
3. Seek activity-based data. Spending proxies could only be used if absolutely necessary or allowed, and it was clear what assumptions were taken.
4. Build procurement team competency. Scope 3 accountability could be built into buyer training and KPIs.
5. Engage suppliers. Identify co-decarbonization goals along with suppliers, and co-create and co-invest in solutions (low carbon steel, renewable energy, etc.).
Through the upstream Scope 3 strategies that are integrated with related procurement, data governance, and supplier engagement, companies can move from compliance to a competitive differentiator. IFRS S2 has made transparent upstream disclosure a financial obligation rather than just a sustainability measure.
20 Sep 2025
Scope 3 Foundations: IFRS S2 and Enterprise Value
For most organizations, the greatest contributions to their climate impact lie beyond the walls of their operations. Every thing from the materials they procure, to how customers utilize and dispose of their products, corresponds to these invisible emissions—Scope 3 emissions—which includes more than 70% to a corporation’s carbon footprint.
Beginning financial years starting on or after January 1, 2024, Scope 3 emissions will be part of the sustaining disclosure requirements under IFRS S2, forcing companies to transition from qualitative pursuits to numbers—in other words, auditable figures. This change means everything—right down to their supply chains and investor relations.
Big Picture: Scope 3 Emissions
Scope 3 emissions are all the indirect GHG emissions that occur at a company’s value chain, other than use of a company’s energy, or company operations. Scope 3 captures activities both upstream (e.g. production of purchased goods) and downstream (e.g. use and end-of-life of products) across 15 defined Scope 3 categories as set below by the GHG Protocol.For practical purposes, the Scope 3 portion of total emissions is usually larger than the scope 1 and scope 2 emissions—according to the GHG Protocol, “Most of a company’s total corporate emissions come from Scope 3 emissions.” Several third-party analyses find Scope 3 is regularly 75% or more of a company’s total carbon footprint, and in some examples, Scope 3 exceeds 90 percent. An example of this is one study of capital goods manufacturers, found that single category (use of sold products), constituted 91% of their total Scope 1+2+3 total emissions.One can see because Scope 3 emissions taken place outside direct control over hundreds or thousands of suppliers, customers, investors, and other chain partners; these Scope 3 emissions are the toughest to measure and manage. This is where companies are left to figure out a complicated meld of data (e.g. supplier data, life-cycle factors, etc.) and where gaps exist, which makes ample room for Scope 3 counting problems and difficulties.
IFRS S2 Disclosure Requirements
The new IFRS Sustainability Disclosure Standards require climate disclosures finish Scope 3 accounting in its entirety. IFRS S2 specifically requires disclosure of absolute (gross) Scopes 1, 2, and 3 emissions (in tons of CO₂e).The standard utilizes the GHG Protocol framework, that “the company shall consider the total value chain… and consider all 15 categories” of Scope 3, and disclose what categories are included. In evident, this means reporting on all relevant Scope 3 categories (that are specified by the Protocol).IFRS S2 is guided as disclosure that investor’s need regarding enterprise value—- as aforementioned it is designed to assess the user’s (governance) related climate values - “cash flows, access to finance or cost of capital” impacted by climate risks associated with climate impact (including value chain emissions).Simply, Scope 3 disclosure is not something that relates to e.g. CSR or simply undertaken something to accomplish something and stands alone; it is intended for better business understanding on how a company’s the future value is impacted and influenced and particularly from the supply chain climate impacts. Hence, IFRS S2 look to be that companies are going to have to start to put a quantity to be complete with Scope 3 in financial disclosures and not only have a qualitative discussion about it.The only concession in the first year is that the IFRS S2 allows and contemplated entities to omit totals under scope 3 value chain for their first report if it is impractical. But again, all categories should be also considered highlighted and explained.
Assessing Material Scope 3 Categories
Deciding which Scope 3 categories to pursue is an important “materiality” exercise. Companies will need to outline their entire value chain, quantify the emissions in each of the 15 categories, and then asses which ones are material by the IFRS/financial-materiality definition.In practice, this means: start with identifying where the bulk of the emissions hot spots are in the value chain —usually identified by spend or volume —and which climate considerations could impact cash flows. Upstream categories typically materialize through procuring: e.g., for a manufacturer, Purchased Goods & Services (Category 1) and Capital Goods (Cat 2) may have a heavier weight. Downstream hot spots depend on a company’s business model: e.g., for OEMs, Use of Sold Products (Cat 11)—i.e., vehicle tailpipe emissions—is oftentimes greater than all other categories combined at ~86% of Scope 3. For financial services, Financed Emissions/Investments (Cat 15) has been shown to be the most material—one report showed that it makes up 99% of Scope 3 for banks and insurers. For some service sectors, there may be a different type of hot spot: a retailer might see significant materiality from product end-of-life (Cat 12) or business travel (Cat 6).For companies, the first step would be to do a broad screening (often using spend or spend multiplied by average emission factor) to rank the categories by scale. They would then want to consider strategic factors—such as who has control over the supplier, customer concentration, regulatory risk—to finalize material categories. The GHG Protocol Scope 3 Standard and calculation guidance provide for the tooling for this decision-making process. Tools would be found in the technical guidance provided by GHG Protocol, ISO 14064 (for overall GHG accounting discipline), and industry frameworks, (e.g., SBTi or PCAF) for category quantifications (e.g., category of product use, financial emissions).
Key Distinctions for 2025: Jurisdictions and Relief
IFRS S2 creates a global baseline, but local regimes differ. It is important to note thatIFRS itself does not compel any jurisdiction to enforce these disclosures; jurisdictions must incorporate IFRS S2 into their own law or regulations.In Singapore, the IFRS baseline has been adopted, but the original timeline has been extensively revised. The Singapore Sustainability Reporting Roadmap, extensively revised in August 2025, now requires Scope 3 reporting to be mandatory only for Straits Times Index (STI) constituents from FY2026, while it remains voluntary for all other listed companies until further notice.
A Systematic Scope 3 Inventory
Creating a strong Scope 3 inventory needs a step-by-step, value chain approach. First, you need to map the value chain: identify significant suppliers, partners, customers, and activities for each of the 15 categories. You can use spend data, supplier lists, materials bills of materials, sales volumes, etc. to discover where emissions are likely to arise.Then, you need to prioritize categories based on potential emissions size and value to the business (e.g., apply spend-based emission factors to determine which categories are largest contributors to your carbon footprint). Third, you need to collect data: involve stakeholders across the corporation. For each significant category, you want to collect primary data if possible (such as supplier-reported emissions, logistics data, or customer product energy use) or proxy data (industry emission factors, spend-based models). For example, you may ask procurement to contact the top 20 hardware suppliers for product carbon footprint data (Category 1) and ask their engineering teams to estimate emissions from software use by customers (Category 11).Finance and accounting should come into alignment on methodology (consistent system boundaries, consolidation approach) and governance. Cross-functional teams are important. Procurement, supply chain, and operations will provide supplier and process data. IT and finance will ensure integration. Product design and R&D will provide downstream use or disposal profiles. HR will provide employee travel/commuting data (Cats 6-7). and legal/compliance will provide oversight on adherence to IFRS.As time goes on you will refine your inventory: start with broad estimates (e.g., spend-based), and then improve as you can get supplier specific data or life cycle assessment conducted for large items. The inventory development should be iterative. Companies should eventually recalculate their Scope 3 estimates annually, and incrementally improve the quantity/quality of data, and fill in estimates.
Strategic Importance of Scope 3 Data
Why go through all this effort? Ultimately, robust reporting of Scope 3 data supports risk management, strategic options, investor assurance and supports: it also provides insight into hidden vulnerabilities (eg, suppliers in carbon intensive sectors), reveals pathways for opportunity (new low-carbon sourcing), and guides product strategy (eg, developing more sustainable designs to lower use-phase emissions). All of these elements are integrative to investor requirements: sophisticated institutional investors have begun looking at supply-chain emissions investments as proxies for future cost pressures and systemic transitional risk.Some concrete examples speak to the value to the business: Royal Philips turned the Scope 3 insights into a “products-as-a-service” business model; it takes back and refurbished large medical equipment that customers return it, and in turn they can sell back “circular”, refurbished systems at a lower price. Here, there is savings on use-phase emissions and new revenue stream generated through refurbished systems. Similarly, Ingka Group, the parent company of IKEA, is developing recycling infrastructure for mattresses, letting them take a waste hot-spot and turn it into a circular opportunity. These some examples of how Scope 3 thinking advances traditional innovation and cost efficiencies: where emissions from end-of-life can lead to companies developing circular solutions which save on input and energy costs.By-and-large, investors are in agreement. The World Economic Forum has highlighted that focus on supply chain emissions “will be a game changer” – as our case studies and research you will see with all 3 companies, we have estimates around 80% of their scopes were in Scope 3. There are key reasons; companies with reputationally have lower funding cost and higher ESG ratings because investors understand their disclosures as thorough by focusing on Scope 3 emissions. In a nutshell, a credible Scope 3 emissions inventory is not just a compliance task; it provides insights into climate change related transition planning; de-risking the business; and potentially large-scale cost savings (less material cost, new green/novel product development, and better reputational improvements).
Actionable Takeaways
Leaders have no time to waste. To prepare for IFRS S2 Scope 3 reporting, companies should:
1. Perform a value-chain materiality scan today. Scope all 15 Scope 3 categories and estimate emissions (even at a high level) to find the largest emitters. Update your matrix – connect climate decisions to enterprise-value implications
2. Establish a cross-functional team. You need a working group (procurement, finance, ops, R&D, sustainability, etc.) - charged with developing a Scope 3 Inventory.
3. Establish a cross-functional team. You need a working group (procurement, finance, ops, R&D, sustainability, etc.) - charged with developing a Scope 3 Inventory.
4. Make sure that procurement/supply-chain contributors lead on upstream data, and product categories lead on downstream. The possibilities for collaboration here are endless – consider having these contributors also involved in an ethical supply-chain committee with a charter, timeline, and accountability to understand how upstream will affect downstream value.
5. Build out data systems, supplier engagement. You should build even basic tools or platforms for value-chain data collection (e.g., supplier questionnaires, spend-based calculators). Then have targeted collectors for biggest suppliers, and/or partner with suppliers to collect data and upload to emissions databases. Make sure that you acknowledge which early-stage Scope 3 use will yield highly incomplete data - then rapidly re-analyze with each of the new data inputs for later versions.
6. Finance & Investor alignment. Use the Scope 3 information to inform risk & opportunity assessment (e.g., supplier carbon risk decision-making for sourcing). Include clear Scope 3 designs for investors - demonstrating how eliminating value-chain emissions is relevant for cash flows. Consider using science-based targets or an internal carbon price that even estimates Scope 3 emissions.
7. Disclosures & audits.Since IFRS S2 will be reported in 2024-year-end reports, start preparing between now and end of financial year this year for climate disclosures. Store away any metrics and assumptions based on projections, to capture-emissions scope calculations that are audit-able. Even if Scope 3 is allowed to be deferred in the first report, note plans to include it in 2025. Early action will ensure compliance and build credibility with stakeholders.
If companies do these activities this year, not only will they be compliant with new IFRS S2, but they will also be able to shift the pre-emptive Scope 3 compliance burden into a value chain asset.
Email: [email protected]
LinkedIn: www.linkedin.com/company/sustainasys
Legal: Privacy Policy | Terms
Join the Waitlist
Thought Leadership on ESG and Carbon Reporting
We’re committed to driving change and sharing valuable insights with the ESG community. Our articles explore the latest trends, regulations, and best practices.
Email: [email protected]
LinkedIn: www.linkedin.com/company/sustainasys
Legal: Privacy Policy | Terms
Email: [email protected]
LinkedIn: www.linkedin.com/company/sustainasys
Legal: Privacy Policy | Terms
Thank You
Look forward to serving you.
Email: [email protected]
LinkedIn: www.linkedin.com/company/sustainasys
Legal: Privacy Policy | Terms